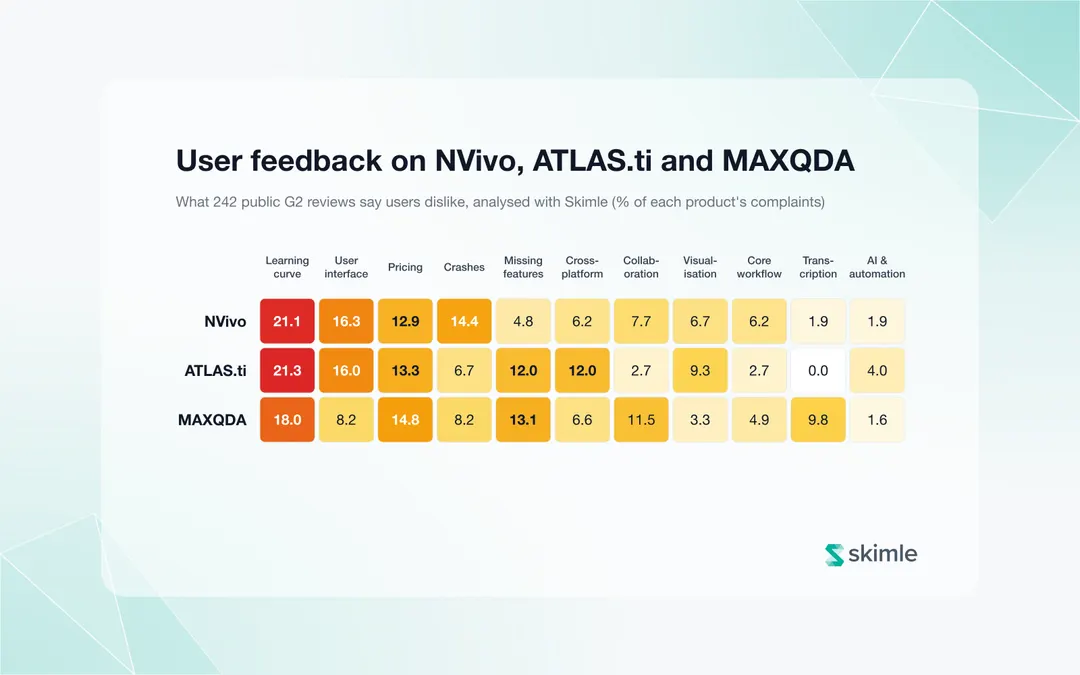
Based on analysing 242 public G2 reviews of NVivo, ATLAS.ti and MAXQDA, the steep learning curve is the top complaint for all three, at 20% of each product's dislikes. NVivo draws twice the others' share of crash complaints, NVivo and ATLAS.ti (both Lumivero products) attract most interface complaints, and MAXQDA users mostly ask for missing features, collaboration and transcription.
Below I explain how I analysed the reviews, show the heatmap of complaints by product, and go through each of the 11 themes in the reviewers' own words. If you only have a minute, the 45-second video below walks through the heatmap and the main findings.
A disclosure first: I am a co-founder of Skimle, a modern alternative to these three tools. I used Skimle itself to run the analysis (in automatic mode i.e. just asking it to identify themes and sub-themes across the corpus) and the primary purpose originally was to discover the gaps to understand where our product needs to shine. But since the findings were quite amusing and partly matched with the common stereotypes of the three packages, I thought why not also publish it.
Behind the scenes: How did I analyse 242 user reviews of NVivo, ATLAS.ti and MAXQDA?
G2 asks every reviewer what they like and what they dislike about a product. I collected all the public reviews of the three tools: 242 in total, 144 for NVivo, 60 for ATLAS.ti and 38 for MAXQDA. That is close to every review G2 lists for these products, so this is nearly a census rather than a sample. The reviews span 2017 to 2026, with 2019 the largest year (89 reviews). For this analysis, I focused on the dislikes to spot the frustrations of the users. All the themes come inductively from the data, and each number links to specific coded segments in the source materials.
The unit of counting is the insight, one distinct complaint, rather than the review. A review saying "it crashes, and the licence is expensive" adds one insight to Crashes and one to Pricing. NVivo reviews produced 209 complaints, ATLAS.ti 75 and MAXQDA 61. Every percentage in the heatmaps is a share of that product's own complaints, so products with different review counts can be compared.
The workflow had five steps:
- Import. I loaded the reviews into Skimle as a spreadsheet. Each row became a document, and the other columns (product, star rating, review date, reviewer industry, company size and G2 badges) became metadata attached to that document. Skimle's spreadsheet import handles this without any reformatting.
- Inductive analysis. I ran Skimle's automatic thematic analysis with no predefined codebook. Skimle read each review, extracted every distinct complaint as an insight with its verbatim supporting quote, and grouped similar insights into categories from the bottom up. The result was 11 top-level themes and 56 subcategories, covering 345 coded complaints.
- Review of the structure. I checked the proposed categories against the underlying quotes in the categories view and verified that the AI-driven categorisation made sense. It's a matter of taste and judgement on how to classify quotes, and in this case I mainly stuck with Skimle's coding. When doing more rigorous research it makes sense to take full manual control of the categories and e.g., explore alternative category structures.
- Comparison by product and manual analysis. I started the analysis with Skimle's Visualisation tool and used the Metadata explorer to produce the heatmap of complaints by product. I then wrote the main observations and storyline.
- Connecting to Skimle with MCP. For the writeup itself, I connected Claude Code to the Skimle MCP server. Since the Skimle project file is well structured and only contains verified quotes, it's possible to access it safely using agents. The AI agent pulls the category structure, verbatim quotes and statistics directly from Skimle and can construct the report draft and produce the images from the Visualisation tool's statistics. My role then was to edit the draft.
With manual approaches, analysis like this would have been a week of work of a product manager or business analyst. With just basic AI tools like ChatGPT, it would be fast but unreliable, requiring manual checking of the outputs and likely creating narratives not supported by the data itself. Skimle combines both rigour and speed into one. The same approach works for app store reviews, customer feedback or open-ended survey answers about your own product. Naturally this type of analysis (200+ open ended answers) is just a particular kind of qualitative analysis, and in other cases the workflow and time requirements will be different when using Skimle.
Some limitations of the dataset to note. Firstly, most reviews were incentivised by the vendors themselves. 71% carry G2's "Incentivized" badge, and research such as Costa et al. (2019) in the Journal of Retailing and Consumer Services finds that incentivised reviews differ systematically from organic ones in length and sentiment. Second, older reviews describe older versions. A 2019 complaint about NVivo 12 may not apply to NVivo 15, so I note where a theme persists into recent reviews. All three products are subject to the same biases, so the comparison between products is more reliable than the absolute levels.
Which problems do NVivo, ATLAS.ti and MAXQDA users complain about most?
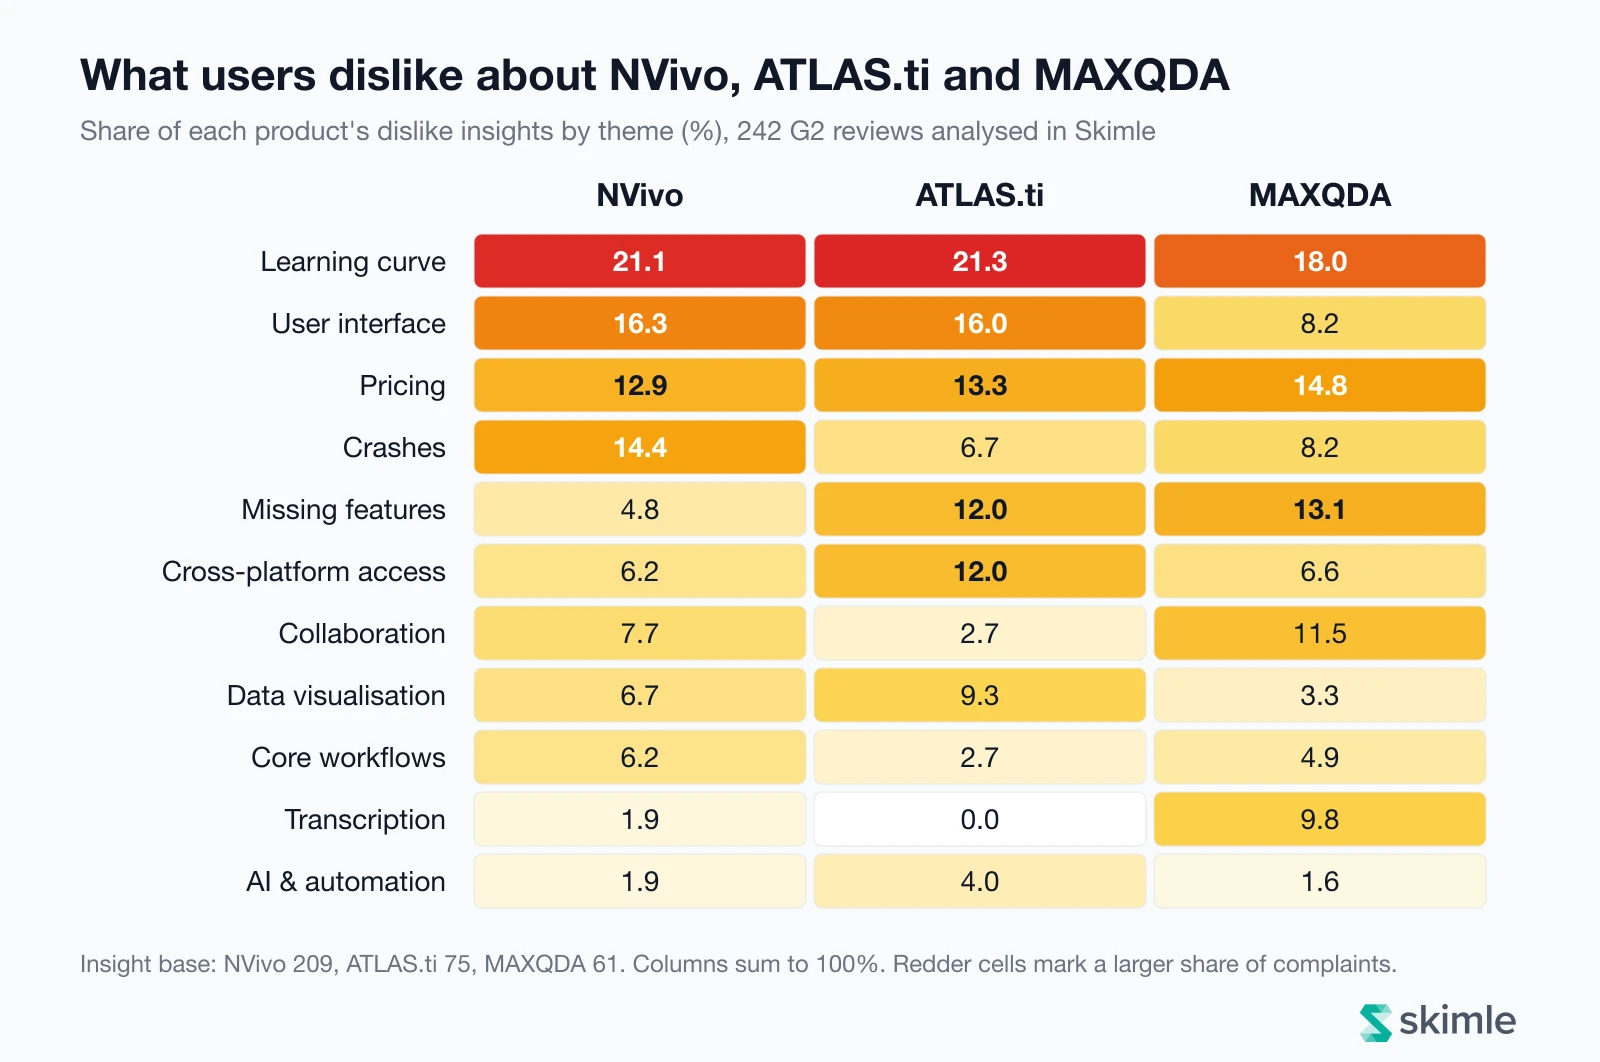
The heatmap shows what share of each product's complaints falls into each theme. Read down a column to see a product's profile, or across a row to compare products on one theme.
| Theme | NVivo | ATLAS.ti | MAXQDA | All complaints |
|---|---|---|---|---|
| Learning curve | 21.1% | 21.3% | 18.0% | 71 |
| User interface | 16.3% | 16.0% | 8.2% | 51 |
| Pricing | 12.9% | 13.3% | 14.8% | 46 |
| Crashes | 14.4% | 6.7% | 8.2% | 40 |
| Missing features | 4.8% | 12.0% | 13.1% | 27 |
| Cross-platform access | 6.2% | 12.0% | 6.6% | 26 |
| Collaboration | 7.7% | 2.7% | 11.5% | 25 |
| Data visualisation | 6.7% | 9.3% | 3.3% | 23 |
| Core workflows | 6.2% | 2.7% | 4.9% | 18 |
| Transcription | 1.9% | 0.0% | 9.8% | 10 |
| AI & automation | 1.9% | 4.0% | 1.6% | 8 |
Five patterns stand out:
- The learning curve is a pain across NVivo, ATLAS.ti and MAXQDA. It is the largest theme for all three products, at roughly one complaint in five. Despite being decades old, these products have not solved the problem of making traditional coding software easy to learn.
- Interface complaints cluster on the Lumivero products. NVivo (16.3%) and ATLAS.ti (16.0%) attract twice the share of interface complaints that MAXQDA does (8.2%). Both are now owned by Lumivero, which formed around NVivo's developer QSR International in 2022 and acquired ATLAS.ti in September 2024.
- Crashes are mainly an NVivo problem. 14.4% of NVivo complaints concern crashes, freezing, slowness or lost work, against 6.7% for ATLAS.ti and 8.2% for MAXQDA. In absolute terms, 30 of the 40 complaints in this theme are about NVivo.
- ATLAS.ti and MAXQDA users want more. For them, missing features account for 12-13% of complaints, compared with under 5% for NVivo. ATLAS.ti users also often mention moving between Mac, Windows, cloud and mobile (12.0%).
- MAXQDA's distinct pain points are teamwork and transcription. It has the highest share of collaboration complaints (11.5%) and almost all the transcription complaints in the dataset (6 of 10).
Pricing is the one theme that is flat across products, at 13-15% for all three. That fits a market where the three tools price within a similar range. Our breakdowns of NVivo pricing, ATLAS.ti pricing and MAXQDA pricing cover the actual numbers.
The sections below take each theme in turn, in order of overall size.
Why do users find NVivo, ATLAS.ti and MAXQDA hard to learn?
With 71 complaints, the learning curve is the largest theme by a wide margin. The pattern is consistent: the software is capable but slow to learn, the official materials are long or hard to find, and many users end up building their own training. My own experience from LinkedIn aligns with this: there must be hundreds if not thousands of people making a living from trying to teach people how to use these products.
The time cost is the most common element. An ATLAS.ti reviewer wrote that "the training videos and manual require a full week to get oriented to." An NVivo reviewer put it simply: "NVivo requires a lot of time to understand and learn." A MAXQDA reviewer framed it as a commitment: "You will need to commit some time to learning the software to succeed."
The second element is training that happens outside the product. A MAXQDA user in undergraduate research described having to "click back and forth between YouTube and MAXQDA in order to follow the video guides, which was time consuming and tedious," and ended up writing their own "Getting started" guide for the team. An NVivo user reported that "my Learning and Development team created a basic training." Another felt they were missing out: "there were features of NVivo that I was not utilizing because I did not know about them, and I could not find any training that NVivo offered."
Some reviewers accepted the difficulty as the price of flexibility ("given the many options and needs of its users, this is understandable"). The recurring subtext is that the software assumes you already know qualitative coding: it is "best for those who already know how to code data," as one NVivo reviewer put it. This can be a bit of a chicken-and-egg problem, as often qualitative analysis courses start with practicing manual coding so the people are facing a double hurdle of learning the thinking and learning the complicated mechanics of their software. We elaborate on this point in our article "The best tool for teaching qualitative analysis depends on what you're actually teaching".
How Skimle approaches this. Two things are different. First, because Skimle runs the first analysis pass automatically, instead of a blank canvas a new user sees their own data with structured themes and supporting quotes before they need to jump into coding mechanics. Thus they can learn the tool by refining the output, while already seeing the end-to-end chain (e.g., coded data, categories, export reports, visualisations, metadata analyses etc.) to understand what they are refining and building. Second, the learning happens inside the product: new accounts get a set of short onboarding missions on a demo dataset that walk through upload, analysis, editing categories and exporting, which is also slightly gamified to grant credits along the way. The first project guide covers the same ground in writing. If you work in a university setting, our page for academic researchers explains how this fits a thesis or research project.
What do users dislike about the NVivo and ATLAS.ti user interfaces?
User interface complaints (51 in total) split into two kinds: the software looks old, and it is hard to find your way around.
On the first, reviewers were blunt. NVivo users wrote that the "interface was old" and the "interface feels old," with one comparing it unfavourably to other research tools: "Compared to other research-related software and platforms, it looks really old and hard to use. It's unfortunate for software that costs hundreds of dollars." An ATLAS.ti reviewer said it "LOOKS a bit dated -- windows 98 like". MAXQDA is not exempt, with one user saying some parts "look awkward like DOS", but this kind of comment is much rarer for MAXQDA.
On the second, the complaints are about logic and navigation. NVivo users described icons that "are not immediately intuitive," struggling "to find certain reports after I run them and save them," and an interface that "took too many clicks to get somewhere." ATLAS.ti reviewers wrote that "the interface is not very intuitive," and two flagged the newer cloud product specifically: the web version "still needs to improve a bit in the interface, which compared to the desktop version, is not as intuitive," and "the latest version on the Cloud can be complex for those who have been using ATLAS.ti for many years."
MAXQDA's lower share matches what we found when comparing MAXQDA and ATLAS.ti and NVivo and MAXQDA directly: its interface complaints are about crowding ("command layout is too crowded, but that's a minor") rather than confusion.
How Skimle approaches this. Skimle is a modern web application built in the last few years, so it does not carry decades of accumulated menus. More importantly, it partly automates the steps that generate most navigation complaints: you do not run and save queries to find coded material, because each category already shows its insights, quotes and written summary in one dynamically updated place. Likewise mixed methods analyses are "always on" so you can explore the data fluently. Where it makes sense, Skimle also suggests things to look at, e.g., in terms of which metadata variables could be inferred from the documents (e.g., sentiment, mentioning specific products etc.) and which ones explain differences in the data the best.
Our guide to the easiest qualitative data analysis software compares ease of use across the wider market.
Are NVivo, ATLAS.ti and MAXQDA too expensive?
Pricing complaints are remarkably even: 12.9% of NVivo's complaints, 13.3% of ATLAS.ti's and 14.8% of MAXQDA's. The 46 complaints fall into five subthemes, and the largest is affordability for particular groups (11 complaints).
Students come up for every product. "Too expensive for students to purchase" (NVivo). "For students, the price might be a little bit more" (ATLAS.ti). "Cost restrictive for students. Another thing to buy for class..." (MAXQDA). Others who mentioned price included small businesses ("an economical 6mth or 12 month licence would be appreciated"), non-profits ("NVivo is very expensive for a low-budget nonprofit") and researchers in lower-income countries, with one NVivo reviewer asking for "a reduced price for universities in developing countries with limited resources."
The sharper complaints are about licensing models rather than price levels. A long-time NVivo user described perpetual licences that "are effectively not useful a year later because they will not allow older versions (e.g., NVivo 14) to communicate with newer versions (NVivo 15)" and said the problem "has gotten substantially worse as they switch ownership to Lumivero." On the MAXQDA side, a reviewer regretted that "the company ended perpetual licenses after Maxqda 22, and I think this is a mistake," and another found "the constant version changes (2018, 2020, 2022) make it difficult to afford them and stay updated." One MAXQDA reviewer noted that the software "had to be purchased for each individual laptop [...] and so we were limited to coding on just one device."
Trials are a smaller but specific complaint. Reviewers of both MAXQDA and ATLAS.ti said the free trial is too short to learn the software while a purchase works its way through university administration.
How Skimle approaches this. Skimle has one published price list, with no version upgrades to buy and nothing tied to a device. Individual plans start at €20 (about $23) per month, so a student or consultant can pay only for the months they are analysing. The free trial needs no credit card and comes with 200 credits, enough for roughly 200-300 pages of text. Transcription is included in the same credits rather than sold as an add-on, and there is a separate academic plan. The details are on the pricing page.
Is NVivo unstable? What users say about crashes
This is where the products differ most. NVivo accounts for 30 of the 40 complaints about crashes, speed and reliability, and they are its third-largest theme (14.4%), ahead of pricing.
Some NVivo complaints are minor: "it also crashes from time to time," or "once in a while the software crashes." Others describe lost work: "it did sometimes crash unexpectedly, resulting in a loss of work." One reviewer described a workaround that had become team policy: "everyone using Nvivo is recommended to save two versions of their project; one in the shared drive and one on their private drive or desktop." Another said "the nvivo file types are easily corrupted."
The most serious complaints are recent. A reviewer of NVivo 15 wrote: "The program runs painfully slowly, frequently crashes, and makes even basic tasks frustrating." Another described being unable to upload half their audio files "for the past three weeks because of a system error that they cannot yet resolve." Performance complaints sit alongside crashes: slow loading, laptops running hot, and one user whose "computer sometimes shut off all of sudden" during analysis.
ATLAS.ti and MAXQDA have stability complaints too, but fewer, and they tend to involve scale. An ATLAS.ti user said errors appear "when you have a bunch of dataset," and a MAXQDA user said that "earlier versions 2018 crashed easily when the data was above 1000 transcripts." A MAXQDA reviewer also reported "the software freezing or slowing down, even on small datasets," while noting that MAXQDA saves projects automatically.
Part of the explanation is architectural. All three are primarily desktop applications that keep a project in a local file and process it on the user's own computer, so large projects, ageing laptops and files copied between machines all raise the risk.
How Skimle approaches this. Skimle runs in the browser, and the heavy processing happens on servers rather than on your laptop. There is no local project file to corrupt or accidentally create parallel copies of, and every change is saved as you make it. No software is crash-free, but this architecture removes the specific failure reviewers describe most: a crash on the user's own machine destroying a local project file. For teams weighing the switch, our guides to NVivo alternatives for academic researchers and ATLAS.ti alternatives cover the options in more depth. If your work is market or customer research rather than academic, see how Skimle supports customer and market research teams.
What is missing from ATLAS.ti and MAXQDA according to users?
Missing features make up 12.0% of ATLAS.ti complaints and 13.1% of MAXQDA complaints, but only 4.8% of NVivo's. One reading is that NVivo users are more preoccupied with more basic problems. Another is that NVivo's long feature list leaves less to ask for.
The MAXQDA requests are specific and technical. Reviewers wanted better "import of data from Excel," automatic import of "Twitter or social media big data into MAXQDA automatically like NVIVO," support for XML tagging and the ability to "import emails." Others asked for analysis features: creating "free quotes," easier links between codes, and "easier cross-coding by keeping the same units of text the first coder chose but removing information about what they coded that segment as," a request for blind second coding.
ATLAS.ti requests ranged more widely: document translation ("It could offer translate documents, but it dont do it now"), EPUB support, pie and bar charts, and a general sense that "other CASQAS tools have functionalities not present in Atlas."
How Skimle approaches this. Several of these requests are core to how Skimle works. Spreadsheet import is how this study was done: every row becomes a document and every column becomes metadata or content. Skimle reads and analyses documents in more than 100 languages in the same project, which covers many translation needs. Where you need a feature only a traditional tool has, Skimle's REFI-QDA export moves your documents and codes into NVivo, ATLAS.ti or MAXQDA.
Why is it hard to use NVivo and ATLAS.ti across Mac, Windows and cloud?
Cross-platform complaints are 12.0% of ATLAS.ti's complaints, about double the share for NVivo (6.2%) and MAXQDA (6.6%). The issue is not that a version is missing for one platform, but that the versions differ and do not stay in sync.
ATLAS.ti users described a workflow built around exporting and importing: "the user can not work in sync between devices. The user has to finish the work, export the library, import it to the new device, and then work." Another wrote that "every version has different features, so if you have a desktop Windows at work and use a MacBook at home, then you may face difficulty," and a third that "the cloud version does not have the same experience as the desktop version." One simply wanted to start on a computer and "continue on my android."
NVivo users had the same problem between operating systems: "Differences between Windows and iOS versions. It is very hard to move from Windows to iOS," and "it is not very easy to transition between Mac and Windows users, since they can not use the same versions." Others missed remote access: "a portable option was not offered so if I was traveling it wasn't accessible," and "the lack of cloud functionality... makes it difficult for cross team collaboration."
MAXQDA's lower share fits the vendor's claim that the Windows and Mac versions share one interface and feature set. The MAXQDA complaints that do appear are mostly about compatibility between different versions rather than operating systems.
How Skimle approaches this. Skimle is a cloud application, so there is one version and it is the same on Mac, Windows, Linux or a borrowed laptop. Your project lives in one place, and the device you open it on is just a window onto it. Enterprise customers can control users and access securely, for example by removing departed employees or disabling specific features. Our guide to qualitative data analysis software for Mac covers platform support across the market.
How well do NVivo, ATLAS.ti and MAXQDA support team collaboration?
Collaboration complaints are highest for MAXQDA (11.5%) and NVivo (7.7%), and rare for ATLAS.ti (2.7%), whose web version two reviewers singled out as good for working with remote colleagues.
The common thread for MAXQDA is that teamwork means merging separate project files. Reviewers wrote that "you cannot have multiple users working on the same project and automatically save," that "you have to set up coding in a particular way or merges do not work properly," and that the shared file "gets corrupted easily when shared with others." A reviewer writing from an IT perspective summarised it: "Project sharing and merging work is possible, but it is not as seamless as modern cloud-based collaboration tools."
NVivo's collaboration complaints are fewer but harsher, and they centre on its paid cloud add-on. One review is titled "Avoid collaboration cloud at all costs!!!!" and reports that "NVivo Collaboration Cloud repeatedly failed to sync, produced cryptic errors, and forced my team into manual workarounds that wasted hours." A non-profit wrote that "we paid for a Collaboration license so two people could work on the same project, but it never worked," and could not get a refund. Two NVivo reviewers compared it unfavourably with the web-based Dedoose, including one who said they "will be switching to web-based subscription platforms like Dedoose."
How Skimle approaches this. Because Skimle projects live in the cloud, sharing a project gives colleagues access to the same project rather than a copy, so there is nothing to merge. Each member's role controls what they can see and edit, and tags and notes let a team discuss the analysis inside it.
What do users want from data visualisation in QDA software?
Visualisation complaints are highest for ATLAS.ti (9.3%), followed by NVivo (6.7%) and MAXQDA (3.3%). The requests are mostly for simpler, presentation-ready charts rather than more advanced diagrams.
ATLAS.ti users asked for basics: "Lacks pie and bar graphs. This would significantly improve the extracted results." Another wanted "better visual tools" to "improve the presentation of the achieved qualitative data analysis." NVivo users said it "doesn't have the best visualizations for presentations" and wanted "more visuals or charts with number representations." One NVivo review title summed up the gap: "Easy to Code, Hard to Analyze," because "once coding is complete, it is very difficult to produce and examine quantitative descriptive stats on the codes applied." This matches the finding of Woods et al. (2016), whose review of 763 published studies using ATLAS.ti and NVivo found that researchers mainly used the software for data management and analysis, and rarely to visually display their methods and findings.
How Skimle approaches this. Skimle's visualisations turn coded insights into frequency charts, heatmaps across metadata, and trends over time. Because each count is made of insights, you can click through from any cell to the quotes behind it. We didn't want to make our software a dead end - it's important that researchers can take their findings out and tell the story in a compelling way.
What frustrates users about the core coding workflow?
Core workflow complaints are a smaller theme (18 complaints), but they matter because they describe the central task. Two kinds appear.
The first is effort. ATLAS.ti reviewers wrote that "the process of creating different codes and groups is a lengthy one. For that, we have to go through all the content. This takes a lot of time and effort," and that "adding in codes manually can be a tedious process." An NVivo user asked why, after uploading a file, "do I have to copy its contents and drag it to the new case where it belongs?"
The second is accuracy and consistency. NVivo users reported text that "is sometimes double-coded," and that "if one person codes a paragraph, but others just sentence, it can definitely have an impact on your percent agreement." One NVivo reviewer questioned the value of the software altogether: "You can basically do coding without it and get the same results."
That last comment points at the underlying limit of traditional CAQDAS: these tools organise coding very well, but the researcher still does all of it by hand.
How Skimle approaches this. Skimle automates the first coding pass: it reads every document, extracts insights with verbatim quotes, and builds the category structure. You then review and edit it by merging, splitting, renaming and moving categories, as described in editing in the categories view. The coding is applied the same way across every document, which removes the paragraph-versus-sentence inconsistency between coders. Every insight remains traceable to the source text. Manual coding is also possible.
How good is transcription in NVivo and MAXQDA?
Transcription is a small theme overall (10 complaints), but 6 of the 10 are about MAXQDA, making it nearly 10% of MAXQDA's complaints. Two different problems appear.
Some MAXQDA reviewers wanted transcription built in: "I feel if MaxQDA could add voice to text automatic transcription, it would be amazing!" and "I would like to see an automatic transcription option, instead of having the user type in interviews and focus groups." A reviewer who did use MAXQDA's paid transcription wrote the longest transcription complaint in the dataset:
"The transcription software is expensive and and artificially un-intelligent. Some examples: the same speaker is identified as S1, S2 and S4 in the same transcript. In a group interview with 3 participants, the AI recognized 9 different voices [...] As a result of this, transcript cleanup and editing for a 1-hour interview took me about 1.5- 2 hours per transcript"
NVivo reviewers made similar points about quality and price: "NLP is just not very good. If you can, you should get transcription services," and "transcription price/quality not very good." One noted that it "sometimes struggles with my very English accent."
How Skimle approaches this. Transcription in Skimle is part of the product, not a paid add-on. You upload audio or video, and Skimle returns a speaker-labelled, timestamped transcript from more than 100 languages, with an optional review step to review it before analysis begins. It costs one credit per minute, around $6 (€5) per hour on paid plans. By comparison, NVivo's pay-as-you-go transcription costs about $30 (€28.50) per hour. Speaker separation still works best on clean audio with one person talking at a time, as it does for every tool. Our comparison of AI transcription tools for researchers tests accuracy across the market. After transcription you can decide to keep the original media, in which case you get full transparency from category summary to verbatim quote in transcript to playback of the tape from exactly that location.
What do users say about AI and automation in QDA software?
AI and automation is the smallest theme (8 complaints), and it is the one most affected by the age of the reviews: most were written before the current wave of AI features. The complaints fall into two groups.
Some reviewers wanted more automation: NVivo "doesn't have many automatized functions," and an ATLAS.ti reviewer suggested that "with the advent of Artificial Intelligence, the software could be developed with such technologies in mind." Others found the existing automation unreliable. One NVivo user reported that "NVivo sometimes coded sentiment incorrectly, particularly if there were elements of humor in the text," and that "the bad thing about the automatic coding is that you can't get rid of it in the file." That raises the central design question for AI in qualitative analysis: can you see what the automation did, and can you undo it? We call this two-way transparency.
How Skimle approaches this. Skimle is AI-native, rather than adding it to a manual workflow, and every automated step can be checked and changed. Each insight links to the exact quote it came from, each category can be edited or deleted, and the agentic chat cites verbatim passages for every answer. For a fuller treatment of how AI analysis should and should not work, see our complete comparison of qualitative data analysis tools.
What does this mean if you are choosing QDA software?
Put together, the reviews suggest a few practical rules for buyers.
- Budget for learning time whichever traditional tool you choose. One complaint in five is about the learning curve for all three products. If your team has weeks rather than months, that matters more than any feature difference.
- If stability is critical, test NVivo on your real data first. The gap in crash complaints is large and persists in recent reviews. Test with a project the size of your real one, on the machines your team actually uses.
- For mixed Mac and Windows teams, check cross-platform support. MAXQDA's identical versions show up in fewer complaints. For NVivo and ATLAS.ti, ask how projects move between operating systems and between desktop and cloud.
- For team coding, look at how collaboration actually works. Merging project files and cloud add-ons are the two main sources of collaboration complaints.
- Price transcription separately. For interview-heavy projects, paid transcription add-ons can add substantially to the licence cost.
Frequently asked questions
Which is better, NVivo, ATLAS.ti or MAXQDA, according to user reviews?
No single tool wins on every theme. In this analysis of 242 G2 reviews, MAXQDA drew the smallest share of interface complaints and NVivo the largest share of crash complaints. ATLAS.ti had the fewest collaboration complaints but the most about cross-platform use and visualisation. All three share the same leading complaint, the learning curve.
What is the most common complaint about NVivo?
The steep learning curve, at 21% of NVivo complaints, followed by the interface (16%) and crashes or slowness (14%). NVivo has a much larger share of stability complaints than ATLAS.ti or MAXQDA, including recent reports of slow performance and crashes in NVivo 15.
Are NVivo and ATLAS.ti owned by the same company?
Yes. Lumivero, which formed around NVivo's developer QSR International in 2022, acquired ATLAS.ti in September 2024. MAXQDA is developed independently by VERBI Software in Berlin. In the reviews analysed here, NVivo and ATLAS.ti show very similar shares of interface complaints, about twice MAXQDA's.
How can I analyse software reviews or customer feedback the same way?
Export the reviews to a spreadsheet with one review per row and columns for product, rating and date. Import it into a qualitative analysis tool that turns rows into documents and columns into metadata, run an inductive thematic analysis, then cross the resulting themes with the product or rating column. Skimle does each of these steps directly.
Is G2 review data reliable for comparing QDA software?
It is useful but biased. Most reviewers rated the products highly, and 71% of reviews in this dataset were incentivised. The comparison between products is more reliable than the absolute levels, because the same biases apply to all three. Use reviews to find what to test, then test it on your own data.
Ready to see how your own data looks when the first coding pass is done for you? Try Skimle for free, with no credit card required, and work through the onboarding missions on a demo dataset before uploading your own.
Related reading:
- Qualitative data analysis tools: a complete comparison
- NVivo vs MAXQDA: which qualitative research software in 2026?
- MAXQDA vs ATLAS.ti: which qualitative analysis software should you use?
About the author
Olli Salo is a former Partner at McKinsey & Company where he spent 18 years helping clients understand the markets and themselves, develop winning strategies and improve their operating models. He has done over 1000 client interviews and published over 10 articles on McKinsey.com and beyond. He is a co-founder of Skimle. LinkedIn profile
Sources
- G2 product reviews for NVivo, ATLAS.ti and MAXQDA - G2.com
- Lumivero Acquires ATLAS.ti to Expand Qualitative Data Analysis Portfolio - ATLAS.ti (12 September 2024)
- Lumivero combines QSR International, Palisade and Addinsoft - PrivSource (4 October 2022)
- Costa, Guerreiro, Moro and Henriques (2019), Unfolding the characteristics of incentivized online reviews - Journal of Retailing and Consumer Services
- Woods, Paulus, Atkins and Macklin (2016), Advancing Qualitative Research Using Qualitative Data Analysis Software? Reviewing Potential vs. Practice in Published Studies Using ATLAS.ti and NVivo, 1994-2013 - Social Science Computer Review
- QDA software comparison - MAXQDA
- NVivo transcription service pricing - nvivo.de